
Long Put Option: How It Works, Formulas, and a Real Example
By OptionsPriceCalculator Team · Published September 27, 2026 · Updated September 27, 2026
A long put means buying a put option, which gives you the right, but not the obligation, to sell 100 shares of a stock at a fixed strike price before expiration. It profits when the stock falls below the breakeven point (strike - premium). Your maximum loss is the premium you paid, and your maximum profit is reached if the stock drops to zero.
Traders use long puts for two jobs. One is a bearish bet with a hard cap on risk - the mirror image of a long call. The other is insurance for shares you already own. This strategy is part of our options strategies guide. To test it with your own numbers, open the long put calculator.
How a Long Put Works: Strike, Premium, Expiration
A put is a mirror image of a call. The call buyer wants the stock to rise. The put buyer is paid when it drops.
- Strike price. The price at which you can sell the shares. The higher the strike, the more the put costs.
- Premium. The price of the contract, quoted per share. One contract = 100 shares, so a $4.00 premium costs $400.
- Expiration date. The deadline. A put below the strike at expiration has value; above it, the put is worth zero.
- Implied volatility (IV). The market’s estimate of future swings. Puts on nervous stocks carry fat premiums.
In the money vs out of the money for puts
This trips up many beginners. A put is in the money (ITM) when the stock trades below the strike. It’s out of the money (OTM) when the stock is above the strike.
So a $360 put on a $375 stock is OTM. It needs a $15 drop just to start having intrinsic value.
Long Put Formulas: Breakeven, Max Profit, Max Loss
Every long put trade fits into four lines of math. Run them before you buy, not after.
| Metric | Formula | What it tells you |
|---|---|---|
| Breakeven at expiration | Strike - Premium | Price the stock must fall to for a $0 result |
| Maximum profit | (Strike - Premium) x 100 | Reached only if the stock goes to $0 |
| Maximum loss | Premium x 100 x Contracts | Hit when the stock closes at or above the strike |
| P/L at expiration | [max(0, K - S) - Premium] x 100 | K = strike, S = stock price |
Notice the difference from a long call. Upside on a put is large but not unlimited, because a stock can’t fall below zero.
How It Works in Practice: A Long Put on Tesla (TSLA)
Here’s a setup based on late September 2026 conditions. Tesla trades near $375, its P/E sits far above 300, last quarter’s earnings missed estimates by about 38%, and the next report comes on October 28, 2026.
Say your view is simple: margins are under pressure and another weak quarter could knock the stock down. Instead of short selling, you buy one put:
- Contract: TSLA $360 put, expiring November 20, 2026 (about 59 days out)
- Premium: $21.60 per share -> $2,160 total
- Delta: about -0.37 (the put gains roughly $0.37 for each $1 drop in TSLA, early on)
Note: premiums are illustrative Black-Scholes estimates at ~50% implied volatility. Live quotes will differ - check your broker’s option chain.
The math for this trade
- Breakeven: $360 - $21.60 = $338.40
- Maximum loss: $21.60 x 100 = $2,160
- Maximum profit: ($360 - $21.60) x 100 = $33,840 (if TSLA went to zero)
Scenarios at expiration
| TSLA on Nov 20 | Put value | Profit / loss | Return on premium |
|---|---|---|---|
| $400 | $0 | -$2,160 | -100% |
| $360 | $0 | -$2,160 | -100% |
| $350 | $10.00 | -$1,160 | -54% |
| $338.40 | $21.60 | $0 | 0% |
| $320 | $40.00 | +$1,840 | +85% |
| $300 | $60.00 | +$3,840 | +178% |
| $280 | $80.00 | +$5,840 | +270% |
Try it yourself: load this TSLA setup in the calculator and move the strike or expiry to see the payoff and Greeks change.
Look at the $350 row. TSLA dropped $25 - you were right on direction - and you still lost more than half the premium. With puts, being right isn’t enough. The drop has to be big enough and fast enough.
Long Put vs Short Selling: Which Bearish Trade Is Better?
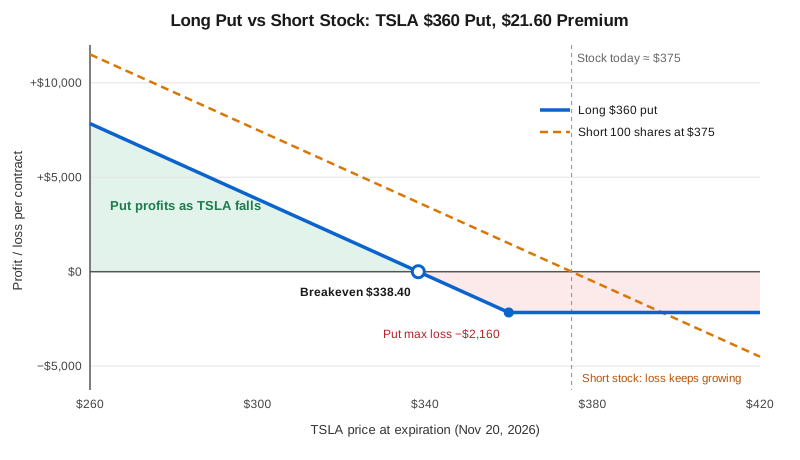
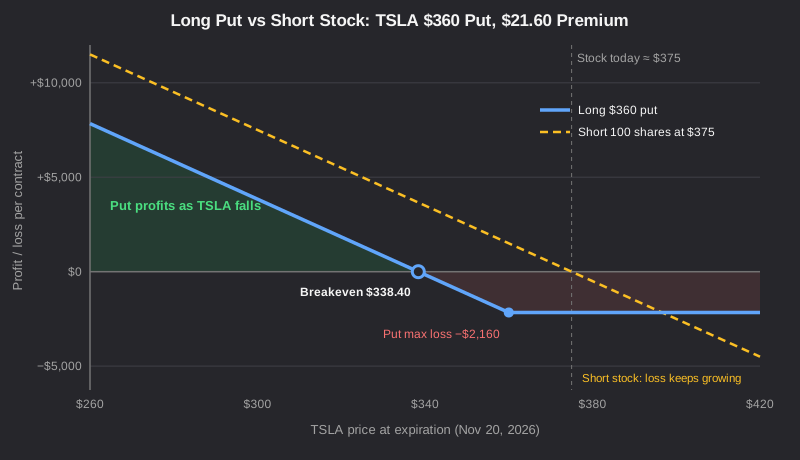
Both trades make money when the stock falls. The risk profile is completely different.
| Criteria | Long $360 put | Short 100 shares at $375 |
|---|---|---|
| Capital required | $2,160 premium | ~$18,750 margin (50%) |
| Max loss | $2,160, fixed | Unlimited |
| Profit at TSLA $300 | +$3,840 (+178%) | +$7,500 (+40% on margin) |
| Loss at TSLA $450 | -$2,160 | -$7,500 |
| Time limit | Expires Nov 20 | None, but margin calls possible |
| Ongoing costs | Theta decay | Borrow fees, dividends owed |
| Squeeze risk | None | High on crowded shorts |
Tesla has a long history of violent short squeezes. That’s exactly why I prefer a put over a naked short on names like this. You know your worst case on day one, and nobody can force you out with a margin call.
Choosing the Strike: ITM vs ATM vs OTM Puts
Same stock, same expiration, three different bets. Strike choice decides how much the stock has to fall.
| Criteria | ITM put ($400) | Near-the-money put ($360) | OTM put ($320) |
|---|---|---|---|
| Est. premium | ~$43.60 ($4,360) | ~$21.60 ($2,160) | ~$8.10 ($810) |
| Delta | ~-0.58 | ~-0.37 | ~-0.18 |
| Breakeven | $356.40 | $338.40 | $311.90 |
| Drop needed from $375 | -5.0% | -9.8% | -16.8% |
| Behaves like | A short stock substitute | A balanced bearish bet | Crash insurance |
On high-IV stocks like TSLA, even OTM puts are expensive in dollar terms. Most traders who buy $320 puts are paying for a crash scenario, and crashes rarely arrive on schedule.
The Protective Put: Using a Long Put as Insurance
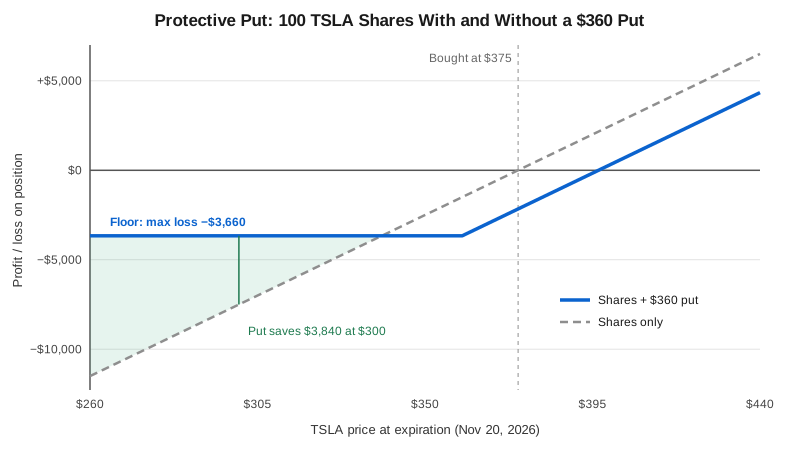
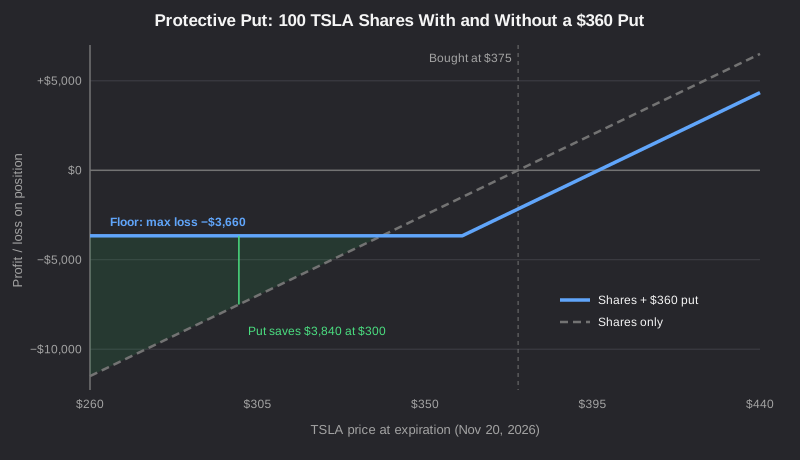
The second job of a long put is hedging. You own 100 TSLA shares at $375 and don’t want to sell before a risky earnings report. Buying the $360 put puts a floor under your position.
- Worst case with the put: ($375 - $360 + $21.60) x 100 = -$3,660
- Breakeven on the hedged position: $375 + $21.60 = $396.60
- At TSLA $300: unhedged loss -$7,500, hedged loss -$3,660
Now the uncomfortable part. That insurance costs 5.8% of the share price for two months. Roll it all year and you’re paying over 30% annually. Nobody’s portfolio survives that for long.
In practice we buy protective puts around specific events - earnings, a Fed decision, a court ruling - not as permanent cover.
Time Decay and Volatility: The Two Silent Costs
A long put loses value every day the stock doesn’t move. For our $360 TSLA put, theta runs at roughly $22 per contract per day.
If TSLA sits at $375 for a month, the put drops from $21.60 to about $13.90 - a 36% loss with zero price movement. With a week left, it’s worth around $4.30.
Why puts get expensive exactly when you want them
Puts rise in price when fear rises. During a selloff, IV spikes and premiums balloon. Buying a put after a stock has already dropped 15% is like buying fire insurance while the kitchen is burning.
There’s also volatility skew: OTM puts usually carry higher IV than OTM calls on the same stock, because demand for downside protection never goes away. You’re paying for that demand.
Rules I follow on long puts
- Buy before the fear, not during it. Enter when IV is calm relative to its 1-year range.
- Give the thesis time. Buy at least 45-60 days, even for a short-term idea.
- Take profits into panic. When the stock crashes, IV jumps too. That’s often the best moment to sell the put.
- Close with 21-30 days left if the move hasn’t happened. Don’t ride decay to zero.
Before placing the trade, check your worst case in the calculator.
Risks and Limitations of the Long Put
A long put limits your loss in dollars. It does not protect you from losing 100% of that amount, and that happens often.
- Total premium loss. If the stock closes above the strike at expiration, the put expires worthless.
- Right direction, wrong size. A 6% drop can still lose money if breakeven sits 10% below the current price.
- IV crush after earnings. On October 28, TSLA could fall 3% and your put could still lose value as volatility collapses.
- Markets drift up over time. Broad indices rise in most years. Betting against that is a headwind, not a neutral bet.
- Expensive hedging. Rolling protective puts continuously eats a large share of long-term returns.
- Early assignment isn’t your problem, but exercise is. Exercising an ITM put without owning shares creates a short stock position. Selling the put is usually cleaner.
When a Long Put Makes Sense (and When It Doesn’t)
It fits when you have a clear bearish catalyst, a defined timeframe, and IV that isn’t already inflated. It also fits as short-term insurance for a concentrated stock position before a known event.
It doesn’t fit when you expect only a slow drift lower, when IV is at a yearly high after a crash, or when you can’t afford to lose the full premium. A bear put spread often does the same job for less money in those cases.
Frequently Asked Questions (FAQ)
What is the breakeven for a long put?
Breakeven equals strike price minus premium paid. A $360 put bought at $21.60 breaks even at $338.40.
Is a long put the same as short selling?
No. Both profit from a falling stock, but a long put caps your loss at the premium, while short selling has unlimited risk.
Do I need to own the stock to buy a put?
No. You can buy a put as a pure bearish bet, or on shares you own as a protective hedge.
What happens if my put expires in the money?
Most brokers auto-exercise it, which sells 100 shares at the strike - or opens a short position if you don’t own them. Close it before expiration to avoid that.
Related strategies
- Twin: Long Call
- Key terms: Put Option, Option Premium, Strike Price, Break-even Price, Delta, Theta (Time Decay)
Risk Disclaimer: This article is for educational and informational purposes only and does not constitute investment, financial, legal, or tax advice. Options trading involves substantial risk and is not suitable for all investors; you can lose the entire amount invested in an option. Short selling carries the risk of unlimited losses. Prices, premiums, and Greeks in the examples are illustrative estimates and may differ from live market data. Past performance does not guarantee future results. Before trading options, read Characteristics and Risks of Standardized Options (OCC) and consult a licensed financial professional.